Wade Brainerd


Warp Trace for PC
This post introduces a GPU performance profiling technique called Warp Trace for PC, using extensions available in OpenGL 4.5 on NVIDIA hardware.
These tools were developed during the research process for our SIGGRAPH 2016 paper Efficient GPU Rendering of Subdivision Surfaces using Adaptive Quadtrees, or AQT for short. Check it out if you are at all interested in real-time subdivision surfaces.
The warp trace idea was inspired by the work of Ste Tovey and his team at Sony, as well as hardware engineers at AMD. See the end of the post for more information.
Warp speed
In past generations of computer graphics hardware, performance was indicated by “triangles per second” or “fill rate”. These terms refer in part to fixed function hardware dedicated to tasks such as rasterizing, and in part to DRAM memory bandwidth.
In 2016, DRAM bandwidth remains an important factor, but scene cost is now typically dominated by shader warp execution.
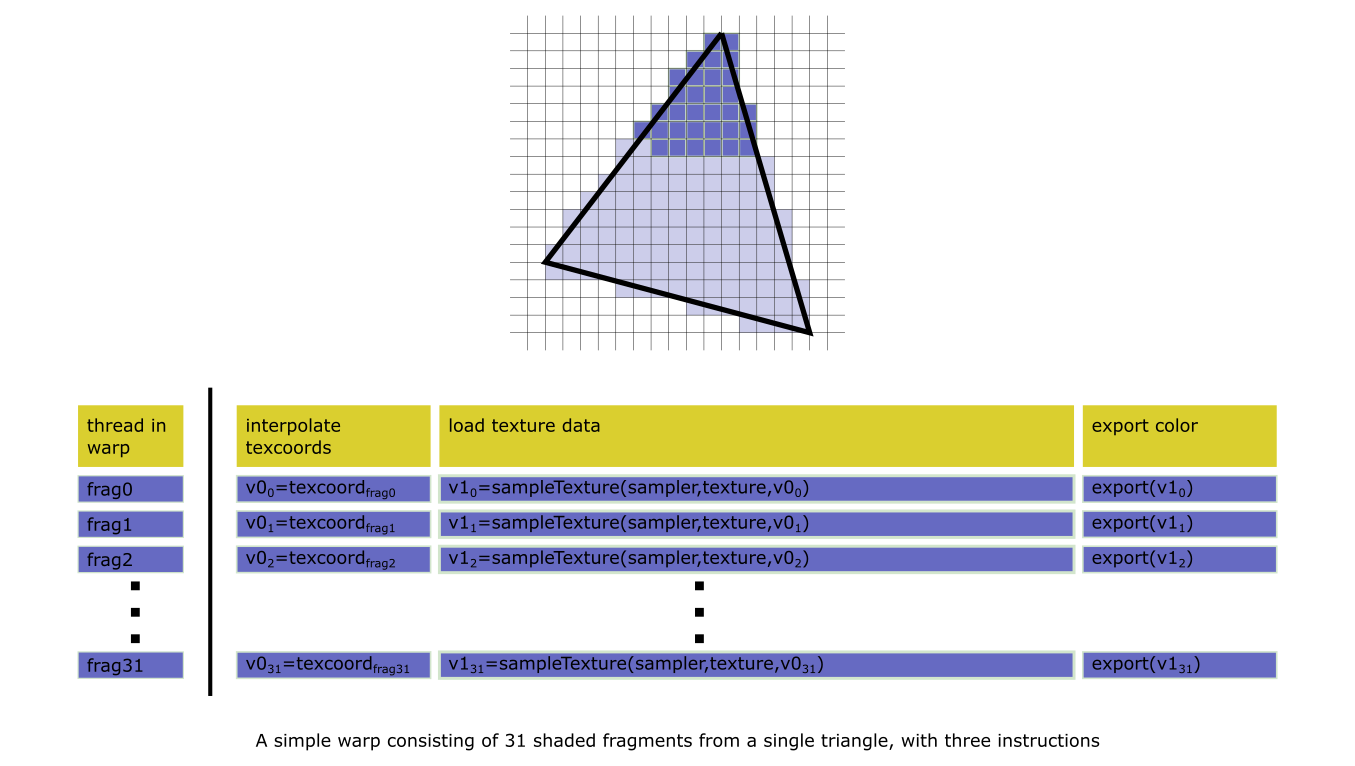
A shader warp represents a shader micro-program processing a batch, or warp, of data. The term is NVIDIA-specific, but the concept applies to all major GPUs.
A warp consists of a number of parallel threads on a GPU core, each executing the shader code for a single data element. In graphics workloads, a vertex shader warp transforms one vertex per thread, a fragment shader warp shades one fragment per thread, and so on.
Warp execution time is affected by:
- the number of warps launched by the draw or dispatch,
- the number of instructions executed by the shader,
- the time spent waiting for memory requests or other fixed function hardware,
- occupancy, or how many warps the GPU can manage simultaneously, which is limited by the amount of hardware resources (such as floating point registers) the shader requires.
Because all threads of a warp execute together, when the execution path diverges between threads, the number of instructions executed becomes the sum of all paths taken.
For a more detailed introduction to modern GPU architecture, see Kayvon Fatahalian’s presentation on the matter.
Profiling warps
Unfortunately, current PC profiling tools do not target warps. Instead, we record GPU timestamps between draw calls and measure the elapsed time. To check for fixed-function bottlenecks, we query pipeline counters using the graphics API: number of pixels rasterized, number of triangles culled, etc.
With timestamps and counters, we can make and test hypotheses about performance by changing the scene and shaders, re-measuring, and drawing conclusions from the results - engines often have a mechanism for live-loading data & shader changes to make this more efficient.
However, it would be nice if we could see the warps, and thanks to NVIDIA GL extensions, we can! Here is a primitive demonstration of the warp trace profiler that I wrote for our paper:
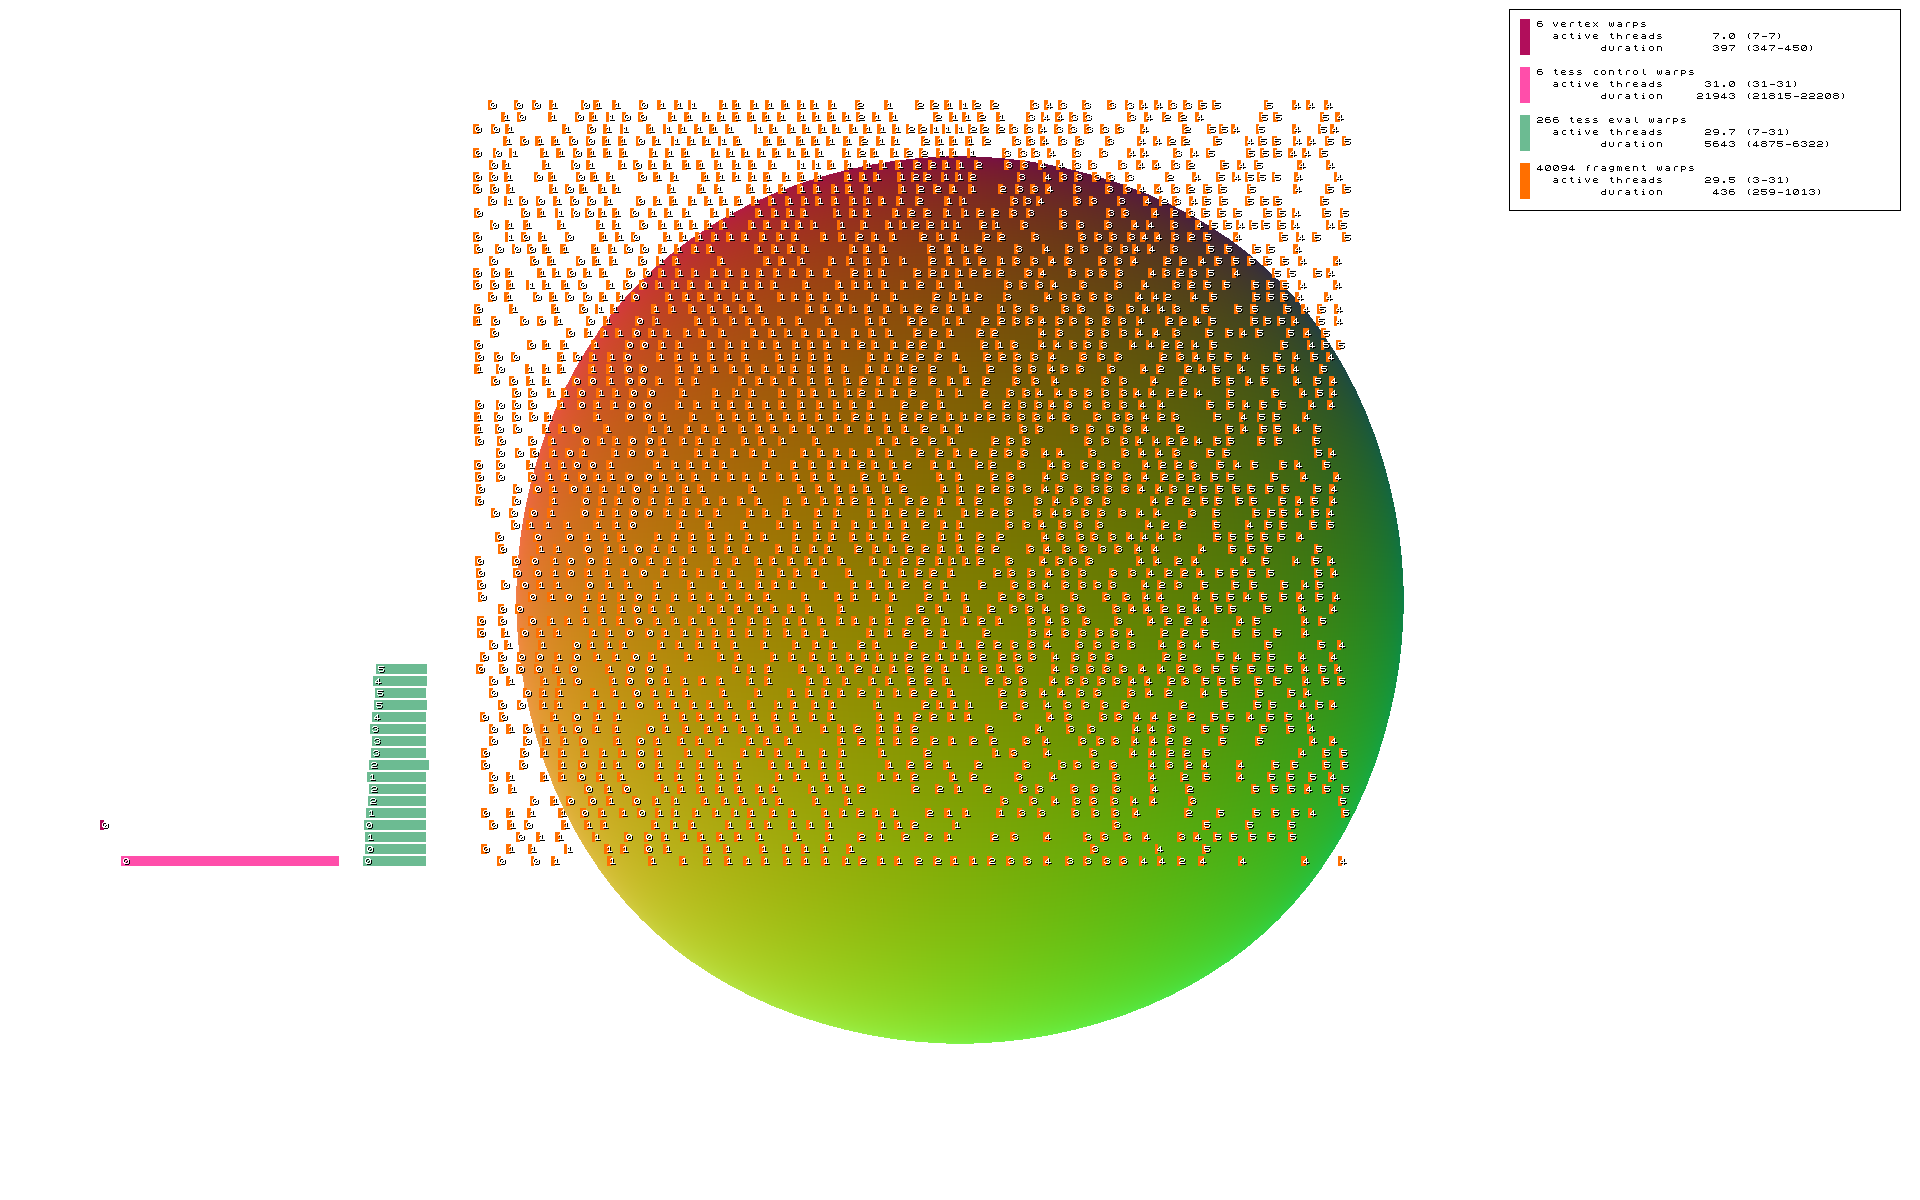
In the image, a 3D render of a sphere is overlaid with a 2D timeline representation of the shader warps executed by a single GPU core.
Purple rectangles represent the vertex shader (VS), pink the tessellation control (TCS, hull) shader, green the tessellation evaluation (TES, domain) shader, and orange the fragment (FS, pixel) shader.
From a cursory glance, it’s straightforward to tell that VS time is short, TCS time is quite long, TES time is moderate with a moderate number of warps, and FS time is short but involves many warps. With warp trace, the relative frequency & cost of each shader stage is shown in an intuitive manner.
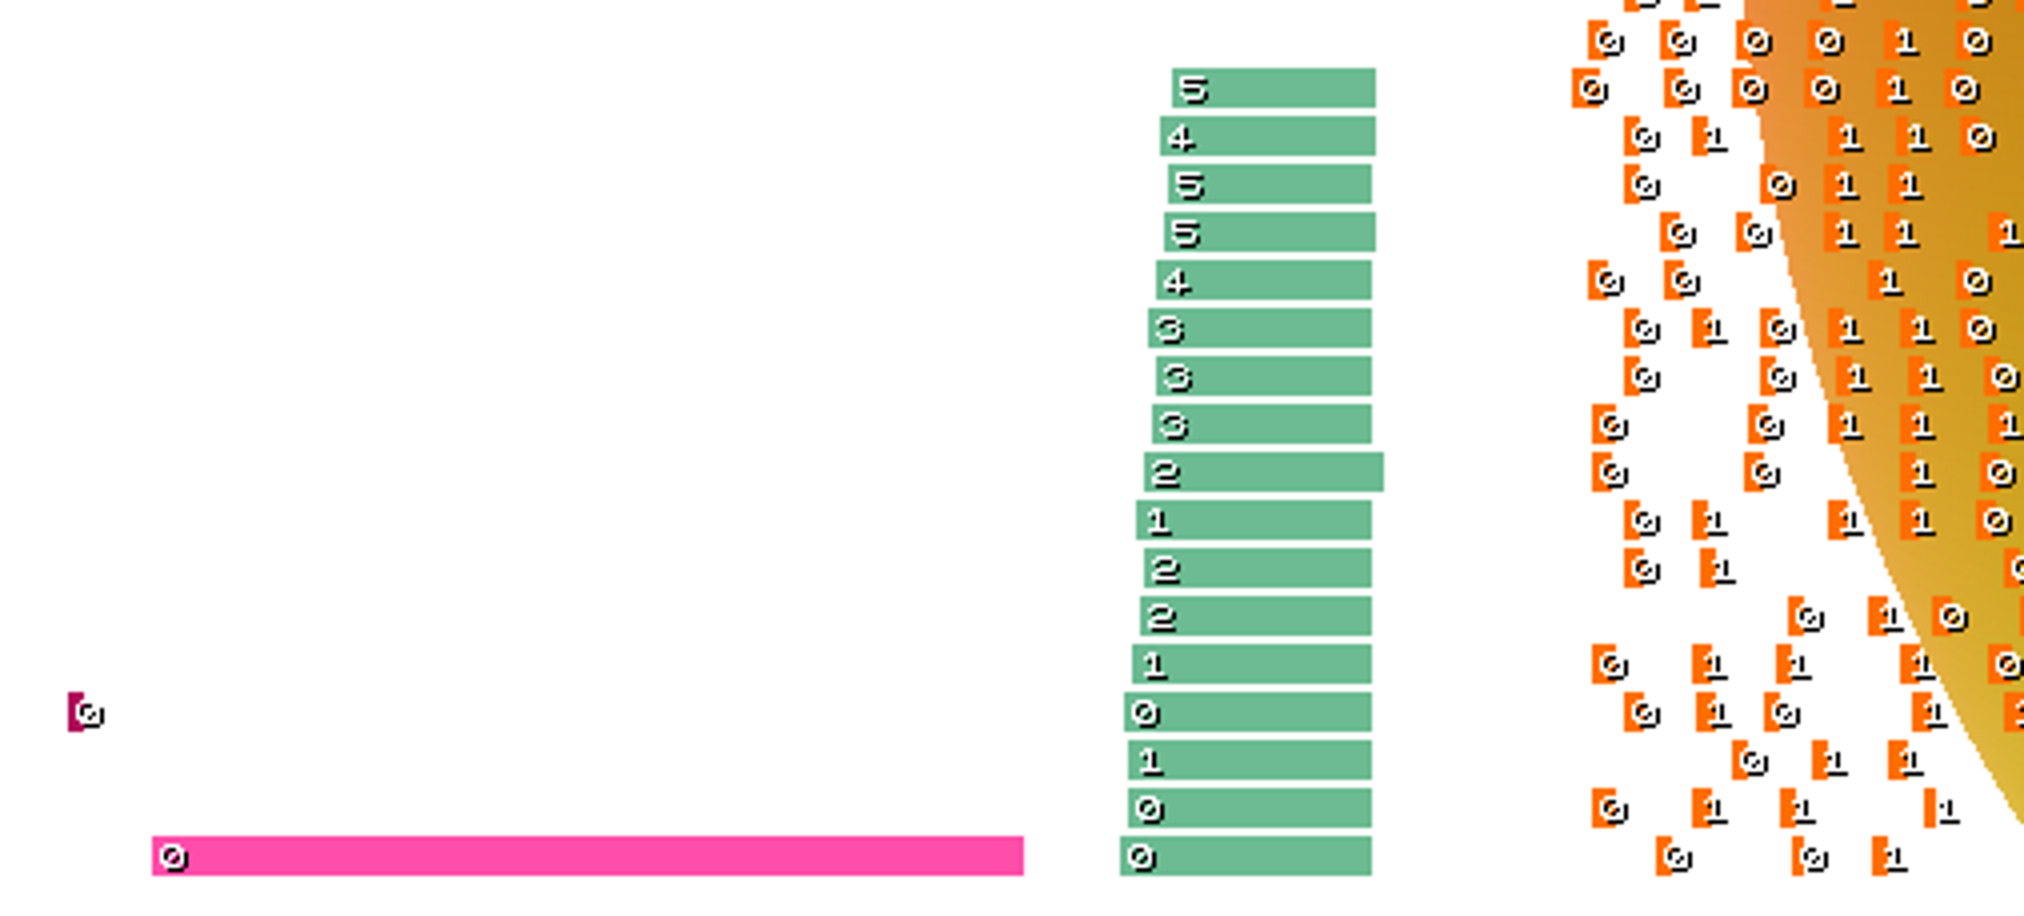
Zooming in, we can see that the tiny number on each warp is a custom ID, allowing warp timespans to be correlated to input data:
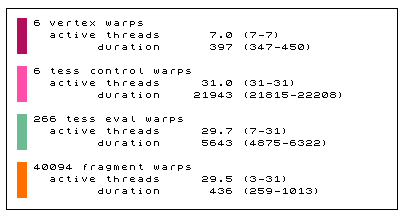
Summary information is given in the top right corner, which hopefully backs up our conclusions, and also gives hard numbers by which code & data modifications can be measured.
The timeline is generated by instrumenting shaders with prologue and epilogue instructions which append the timestamps, warp ID, and other data to a memory buffer.
This is made possible by the GLSL extensions GL_NV_shader_thread_group and GL_ARB_shader_clock.
void main()
{
    BeginTrace( gl_PrimitiveID, TRACE_TES );
    ...
    EndTrace( gl_PrimitiveID, TRACE_TES );
}
The buffer is parsed by the CPU and the visualization is drawn into a bitmap.
void WarpTrace()
{
    unsigned char   *pixels;

    RenderToFile( "warptrace.png", 1920, 1200, &pixels );
    PlotTrace( "warptrace.png", 1920, 1200, pixels );

    LoadLibrary( TEXT( "shell32.dll" ) );
    ShellExecute( NULL, TEXT( "open" ), TEXT( "warptrace.png" ), TEXT( "" ), NULL, SW_SHOWNORMAL );

    free( pixels );
}
The GLSL source code to the prologue and epilogue functions and the C++ rendering functions are provided at the GitHub project page.
Big Guy case study
All case study results were captured on a NVIDIA GTX 980.
AQT uses the graphics pipeline in an unusual way: work is divided between the hull and domain shader stages, and the hull shader is amplified to occupy 32 threads per patch. We needed a way to analyze the cost of the pipeline stages relative to each other, and to identify bottlenecks that might be limiting performance.
Our best performance configuration is to render models as a sequence of irregular, regular quartet, and regular patches. This requires three draw calls, which we analyzed together using warp trace.
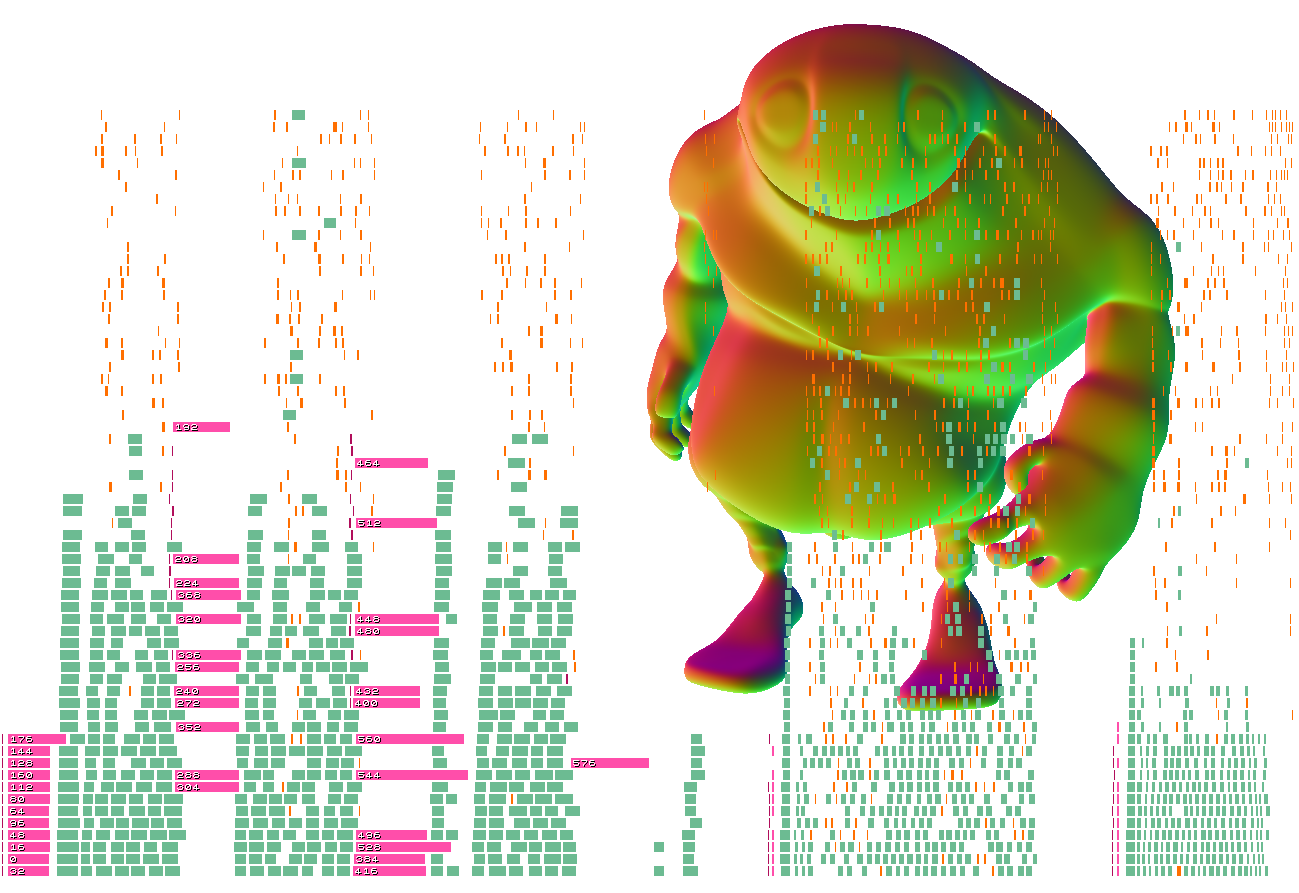
Lurking stalls
From the trace it is clear that the draws are separated by brief GPU delays. Additionally, the first draw has its cost increased by a single leftover TCS warp.
The failure to overlap draws is unexpected, and implies a driver-initiated GPU sync. It diminishes the benefit from separating models into distinct draws, but we were not able to eliminate it.
Mixed findings of occupancy
The second bottleneck evident in the trace is that while as many as 30 TES warps (green) can run in parallel, no more than 12 TCS warps (pink) can. This appears to be a hardware limitation, as we saw no higher occupancy when switching to an empty shader. Lower occupancy potentially hurts the efficiency of the TCS stage, as it can affect the GPU’s ability to hide stalls related to memory access.
The positive data point is the high TES stage occupancy of the first draw. We were concerned that the complexity of the tree traversal code would lead to low shader occupancy and that this would hurt performance. We found that the opposite is true: while irregular warps run longer than regular warps, they reach higher occupancy. For BigGuy this is due to having insufficient patch counts to completely fill the GPU, and in other models we observed that all three shaders run at maximum occupancy.
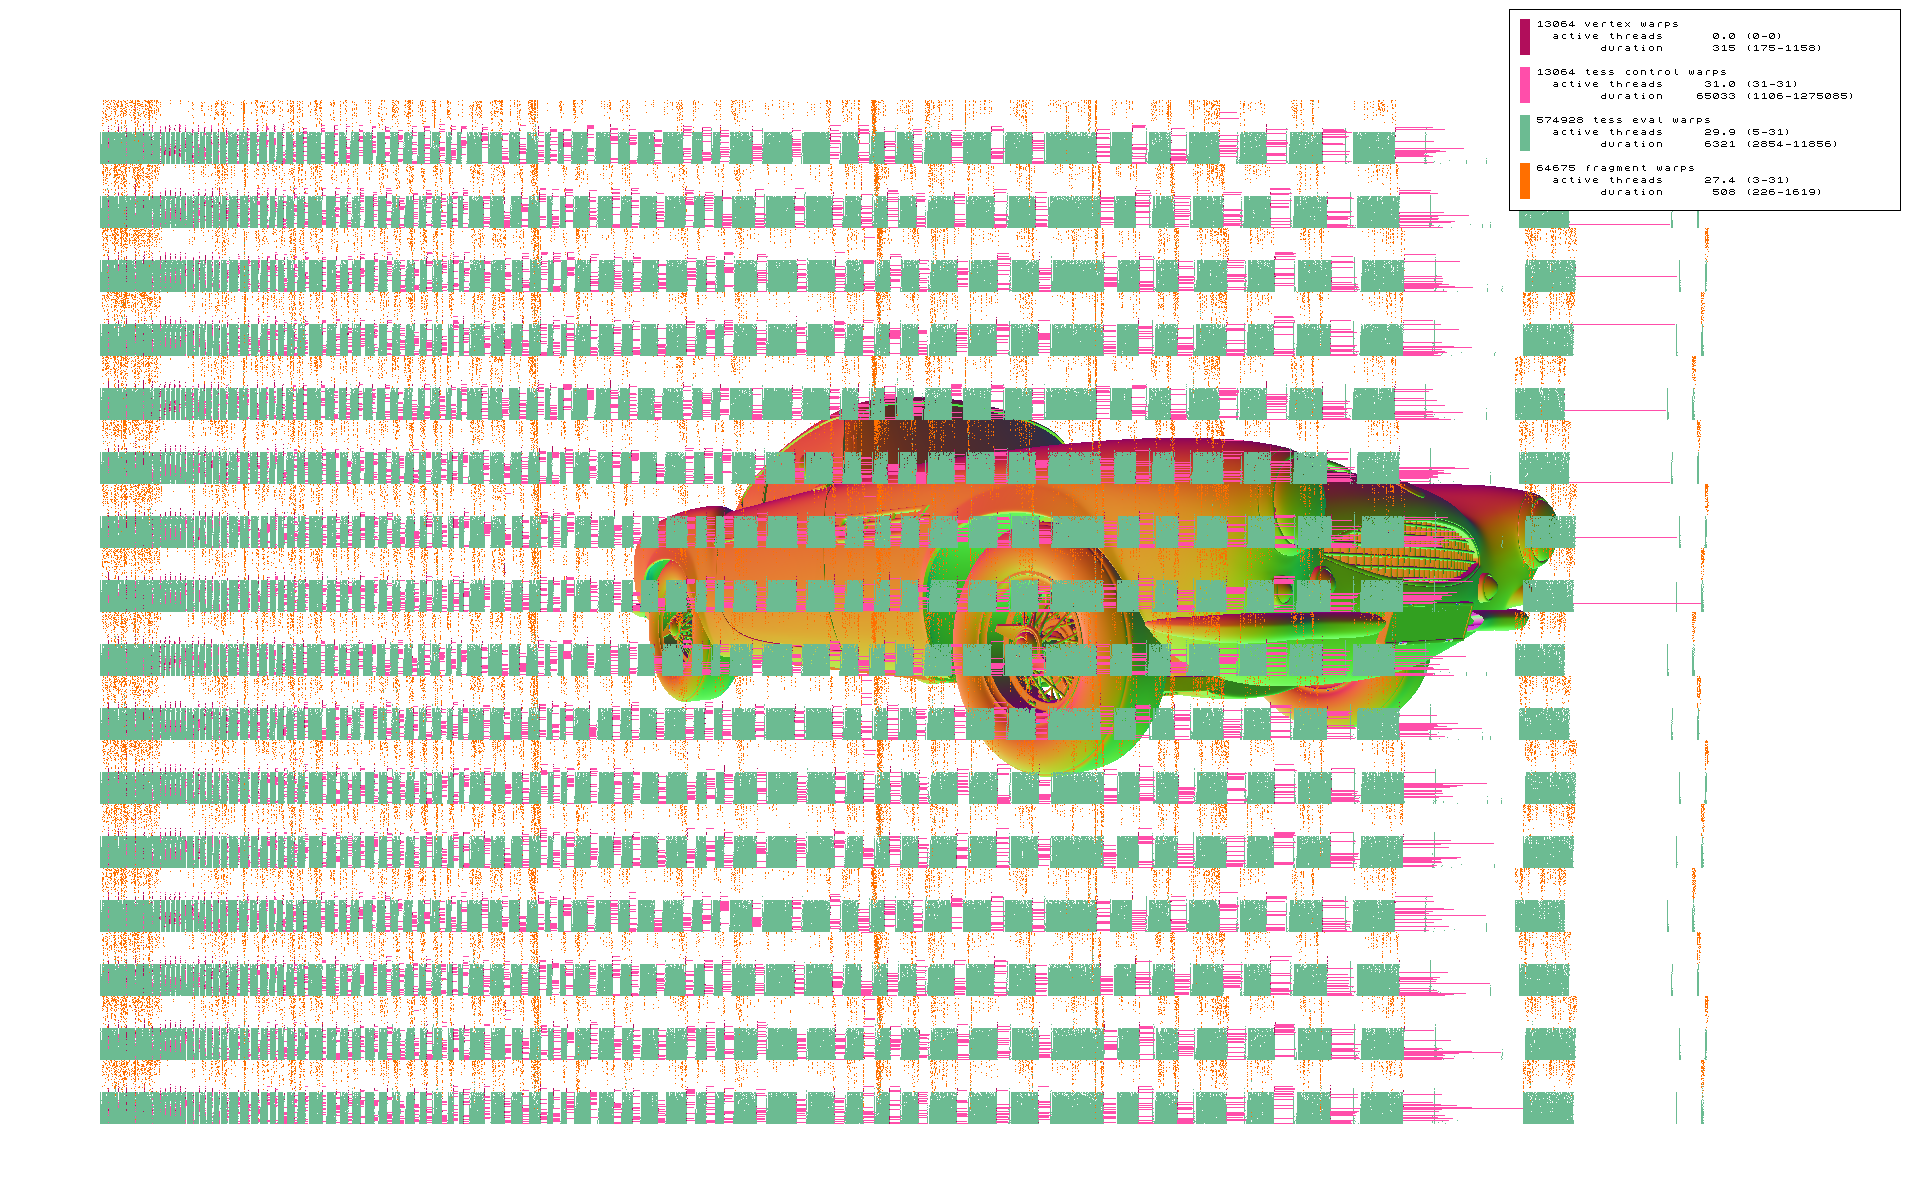
Stirling case study
In addition to capturing a single SM, warp trace can capture all 16 SMs of the NVIDIA GTX 980 GPU, as shown in this trace of the Stirling model rendered as rectangular macro patches.
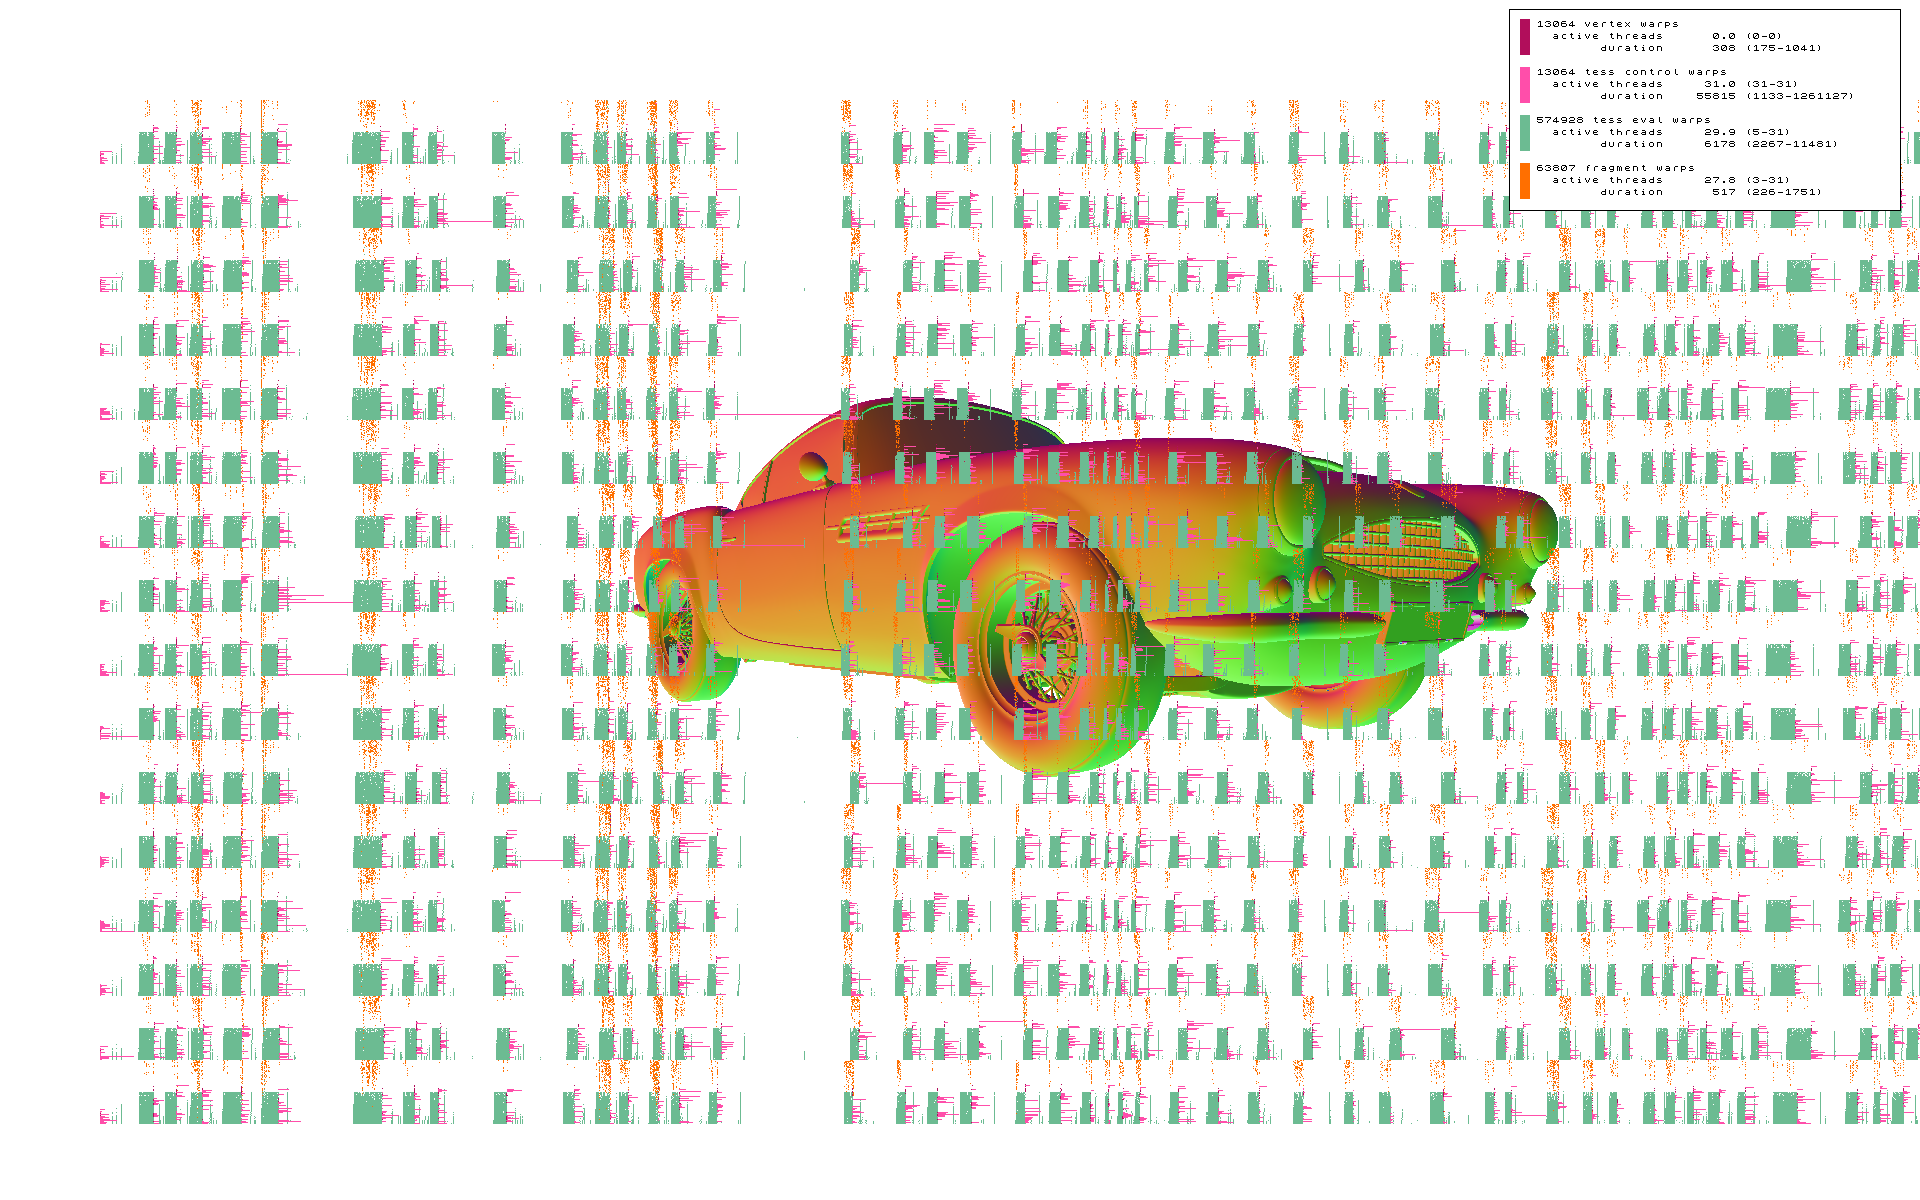
Near the middle of the timeline, a long TCS warp appears to stalls the entire GPU, which initially surprised us. After researching the problem, we learned that this behavior is required by hardware tessellation specification: tessellated triangles must be rasterized in-order, and for hardware context reasons this requires that patches not start TES processing until all of their predecessors have.
By sorting patches according to the expected TCS workload, so that warps of similar cost run in parallel, we were able to mitigate the issue and improve performance significantly. From the statistics box, the second trace has 15% longer TCS warp duration due to many warps running in parallel, but the net draw time is shorter.
Summary
With the warp trace profiler, we have exposed useful, actionable data that was previously unavailable:
- Shader stages - how much time is spent in vertex and fragment warps respectively? Do warps have a uniform cost or is there high variance?
- Occupancy and latency hiding - how many instances of a shader are running simulaneously and how does this affect performance? How many threads are active in each warp?
- Draw call overlap - how much cost of each draw is hidden by running in parallel with others?
- Pipeline stalls - are there any hardware or driver issues hurting performance?
An important item that we don’t cover is:
- Divergence - for what portion of warps are only some threads active, how many, how long?
Divergence could be integrated into warp trace by outputting code flow metadata into the memory buffer, perhaps in the form of additional start/stop tokens, but we did not implement this (see below for another approach to analyzing divergence).
And finally, we should really talk about:
- Overhead - how much do the trace recording functions cost?
I utilized the GL active thread mask extension to only write data from the first active thread in each warp, but there is obviously a cost to the memory traffic and the atomic increment. The warp duration is recorded before the packet is written, so the overhead should appear as extra time between warps, plus a few tens of MB of memory bandwidth, and this bears further analysis. Obviously, dedicated trace hardware would be great, but it’s possible that more software tricks could help too, such as non-cache-polluting writes.
Other visualizations possible
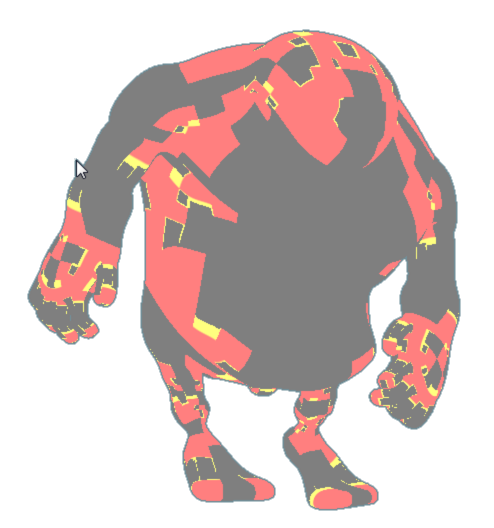
It’s possible to use these GL extensions to create other useful visualizations besides streaming data to a buffer and rendering a timeline. For example, having the fragment shader record its duration and return a corresponding color turns the image into a “heatmap” of pixel cost.
In AQT, I added code to check the active thread mask when traversing the quadtree, and modify the color output. In the image, warps in which all threads traverse the tree are red, warps in which no threads traverse are grey, and warps in which some threads traverse and others don’t are yellow. It is the yellow threads that pay the cost of both branches due to the warp architecture, and visually classifying them helps to check assumptions.
Call to action!
The image synthesis shown here is primitive compared to what’s possible, and in fact better tools are available on consoles. In particular, Ste Tovey and his group at Sony have created a tool for PlayStation 4 called Razor Thread Trace Viewer, which leverages the specialized trace hardware that is present in GCN-based GPUs, shown below.
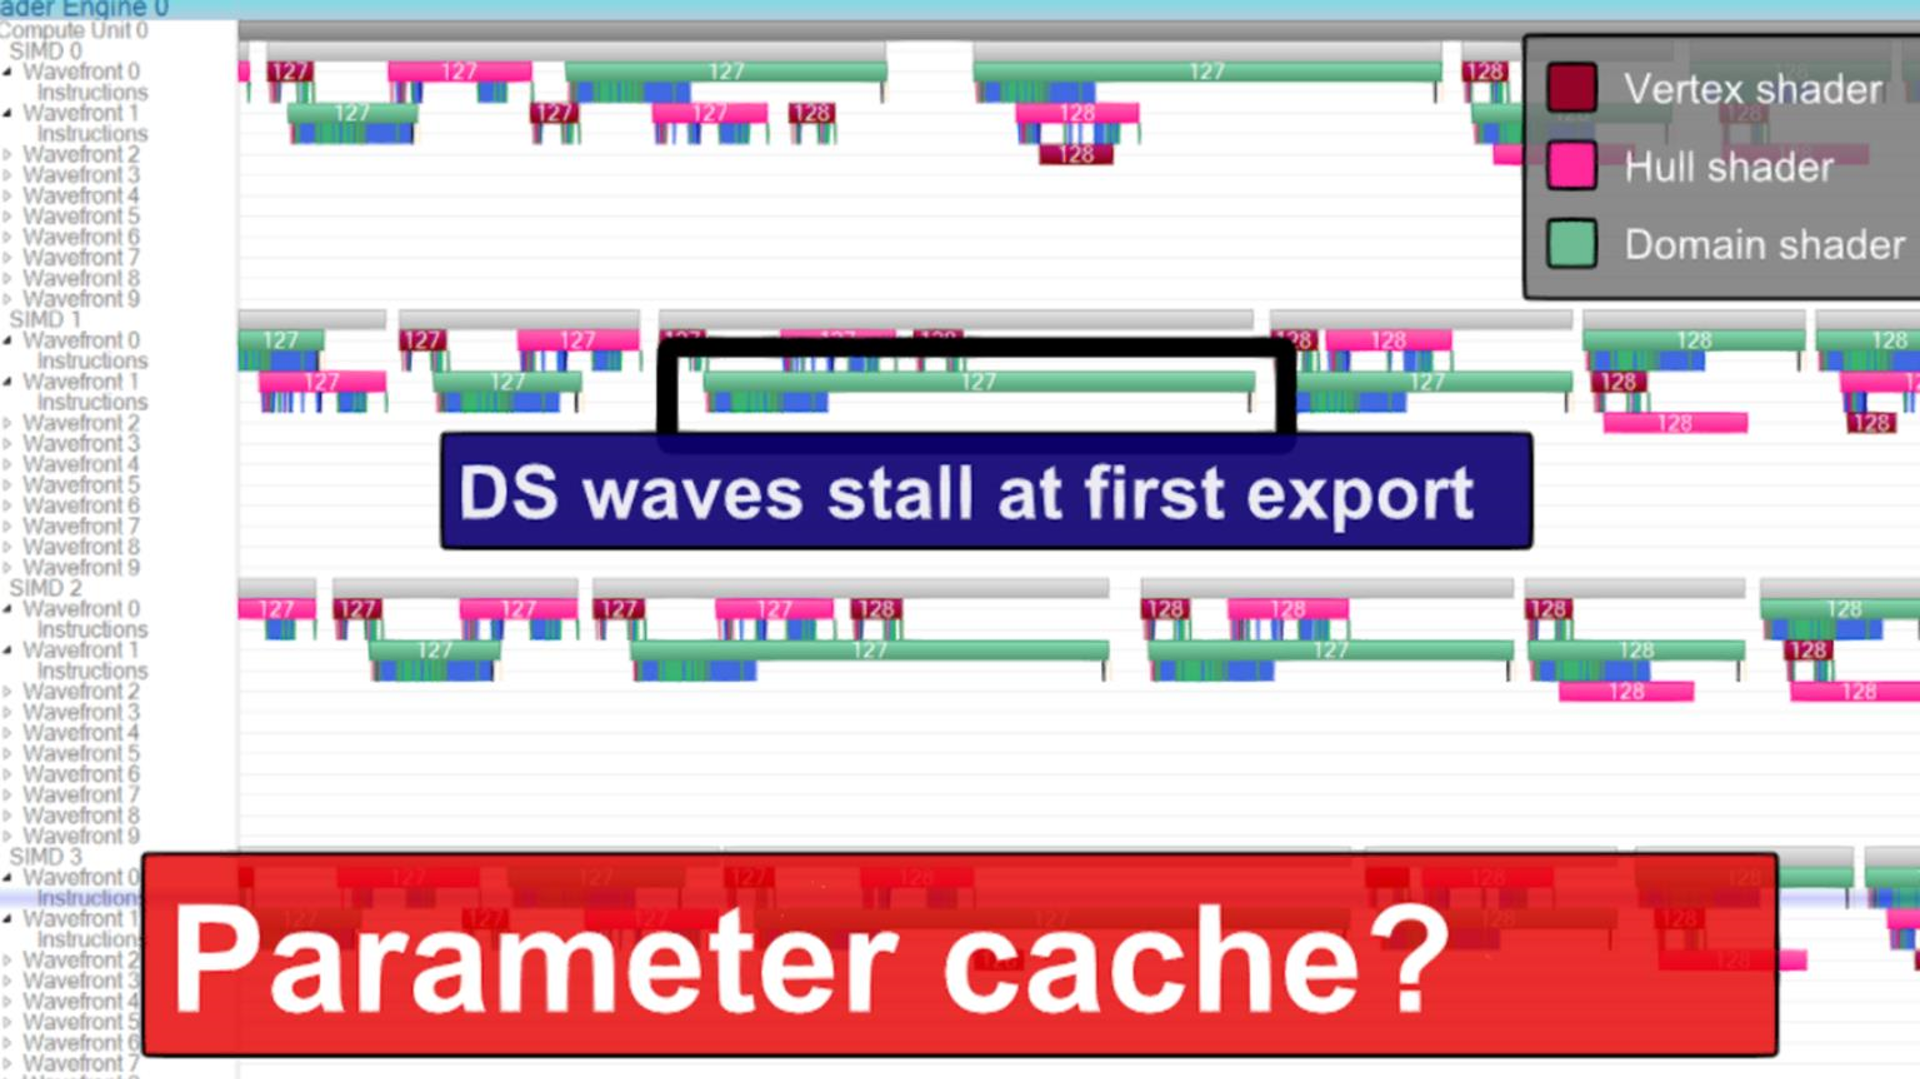
A few more pictures of RTTV and usage case studies can be found in my SIGGRAPH 2014 presentation Tessellation in Call of Duty: Ghosts starting at page 68.
But clearly, specialized trace hardware isn’t required to make something that’s useful. To begin, some things we need are:
- API extensions for Vulkan & Direct3D 12 HLSL to determine SM ID, thread ID, active thread mask, number of threads per warp, and GPU clock in a hardware-agnostic manner. AMD provides some of the required extensions already via the GPUOpen initiative. NVIDIA provides the extensions for Vulkan via VK_NV_glsl_shader, but they are not yet available in SPIR-V. For D3D12, the lane intrinsics have been added in the recently-released shader model 6.0 spec, but clock is missing.
-
A library of shader functions to write trace markers to a memory buffer.
-
A PC library to trigger captures and write the markers to disk.
-
Nice GUI app to explore & analyze the data.
Til they appear, I’ll have to live with pixel plotting.
Get the source code**
https://github.com/wadetb/warptrace
** The GitHub repository currently contains only snippets of code ripped from our research testbed, there is nothing that actually compiles and runs.